Chapter 13: Liquids and Solids
I. Phases of matter and phase changes
a. Recall the three main phases of matter:
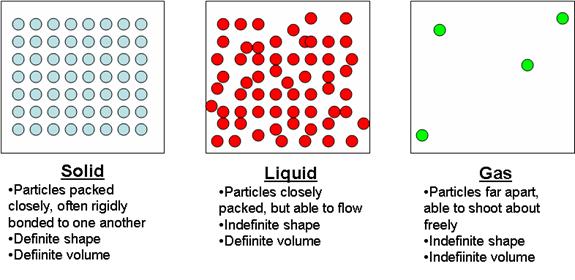
Energy is involved during the transition from one phase of matter to another. You should learn how energy is involved in each of these phase transitions, and you should be able to name each of these phase transitions.
(1) Melting: energy absorbed
(2) Freezing: energy released
(3) Condensation: energy released
(4) Vaporization: energy absorbed
(5) Deposition: energy released
(6)
Sublimation: energy absorbed

Figure 1: A pictorial summary of phase changes. For our purposes, "enthalpy" (symbol = H) is added heat energy.
II. Heat and temperature
a. Heat is a form of energy that flows from hot objects to cold objects. Heat is measured in joules.
b. Temperature is a measure of the average kinetic energy of the particles in a substance. Temperature is measured in °C or K.
c. Although it seems counterintuitive, a substance that is heated will not undergo a continuous rise in temperature. Likewise, if a substance is cooled, its temperature will not decrease uniformly.
In fact, as a substance such as ice is
heated, its temperature will only increase until a phase change occurs. During
a phase change, the temperature of a substance does not change. When the
temperature of a substance that is being cooled or heated does not change, it
is undergoing a phase change.
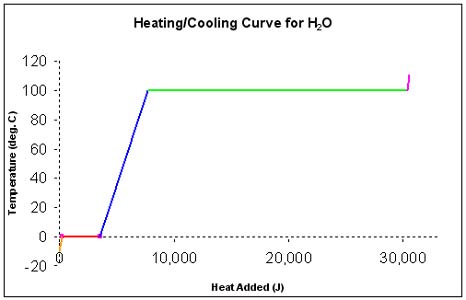
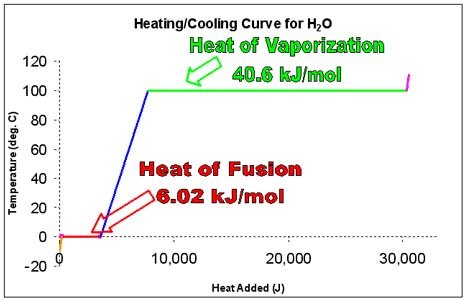
d. In the diagram above, one can see that as ice is heated from -10°C, its temperature increases only until 0°C. From -10°C to 0°C, all of the heat absorbed by the ice goes into increasing the kinetic energy of the ice molecules (they vibrate faster). This period of warming is the small orange line.
e. At 0°C, however, the particles of ice can not move any faster. Therefore, the temperature does not rise. At this point, any absorbed energy goes into making bonds between water molecules break. This period of absorbing energy is represented by the red line.
i. The amount of energy needed to melt a substance at its melting point is called the heat of fusion of that substance. For H2O, that amount of energy is 6.02 kJ/mol.
ii. The temperature at which melting happens is called the melting point of the substance. Believe it or not the melting point is the same as the freezing point. They are the same temperature.
iii. The amount of energy that must be released in order for a substance to freeze at it s freezing point is also called the heat of fusion of that substance. For H2O, that amount of energy is 6.02 kJ/mol.
f. After the ice has entirely melted, the water that forms can be heated to a higher temperature. The temperature of water (at standard pressure) can only reach 100°C.
i. The temperature at which a substance boils is called the boiling point of as substance.
ii. The temperature at which a substance boils when the pressure is 1 atm (standard pressure) is called the normal boiling point of as substance. We will see later that the boiling point and melting point of a substance depend on pressure as well as temperature.
iii. The amount of heat needed to boil a substance at its boiling point is called the heat of vaporization of that substance. For H2O, that amount of energy is 40.6 kJ/mol.
iv. The amount of heat that must be released by a gas - at its boiling point - so that it can condense to a liquid is also called the heat of vaporization of that substance. For H2O, that amount of energy is 40.6 kJ/mol. The boiling temperature for a liquid must be the same as the condensation temperature for the gas phase of that substance.
III. Calculations involving the heating/cooling curve.
a. There are five different regions to the heating/cooling curve for water.
i. The heating/cooling curve for other substances can be constructed for other substances, but we will concentrate on water for the sake of simplicity.
ii. Also, water is a very important substance; therefore, knowing how to perform the calculations for water’s phase changes is very important to a scientist.
b. The heating/cooling of ice: Use q=mCΔT
c. The melting/freezing of H2O: Use 6.02 kJ/mol
d. The heating./cooling of water: Use q=mCΔT
e. The boiling/condensation of H2O: Use 40.6 kJ/mol
f. The heating/cooling of steam: Use q=mCΔT
IV. Intermolecular forces of attraction
a. These are the forces that hold molecule to molecule, not atom to atom.
b. Compare with intramolecular forces of attraction.
c. We care about three main intermolecular forces: hydrogen bonding, dipole-dipole interactions, and London dispersion forces. These were covered earlier and in more detail in the chapter (and lecture notes) on bonding.
i. VERY STRONG: Hydrogen bonding – the attraction between an unshared pair on an atom of one molecule for an electropositive (“electron-starved”) hydrogen atom on another nearby molecule.
ii. SOMEWHAT STRONG: Dipole-dipole interactions – the attraction between to polar molecules
iii. WEAKEST: London dispersion forces – the attraction that one nonpolar molecule has for another nonpolar molecule, due to the temporary uneven distribution of electrons within molecules which causes them to be weakly and temporarily polar.
V. Vapor pressure, equilibrium, and evaporation
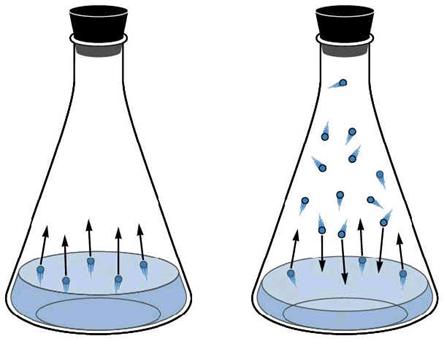
a. All liquids evaporate when left out “in the air.” The highest energy molecules in the liquid phase, when they are on the surface of the liquid, escape to the gas phase.
b. Even contained liquids will evaporate, that is, they will proceed from the liquid to the gaseous state of matter.
c. However, in a contained liquid, as the liquid particles evaporate, the gas formed by them (the vapor) begins to exert a pressure just like any other gas in a container would.
d. As the pressure increases due to the growing number of gas particles, the likelihood of two gas particles interacting and re-liquefying (condensation) increases. After a while, the number of particles entering the vapor phase equals the number of particles re-entering the liquid phase. At this point, we say that a state of equilibrium has been established between the gas and liquid phases.
e. The pressure exerted by a gas that is in equilibrium with its own liquid phase at a certain temperature is called the vapor pressure of that substance.
f. Huge tables are published in huge books detailing the vapor pressures of substances. Alternatively, there are mathematical equations that can predict (or at least estimate) the vapor pressure of a liquid from some of its physical properties.
VI. Phase Diagrams
a. A particular substance can exist in several different phases – sometimes simultaneously – depending on the pressure and temperature at which the substance is held.
b. The phase behavior of a substance can be summarized with a phase diagram.
c. Key features:
i. Triple point: the conditions of temperature & pressure at which all three phases of matter can coexist. What is the triple point of H2O? What is the triple point of CO2?
ii. Vapor pressure: the pressure at which a contained liquid is in equilibrium with its gas phase (vapor). Use the G-L line two different ways:
1. The boundary between the “gas” and “liquid” sections of the graph represents the vapor pressure of the substance. As temperature goes up, the vapor pressure goes up. So, you can determine the vapor pressure for a substance at a given temperature.
2. The boundary between G and L also represents the boiling temperature of the substance at a given pressure. What is the boiling temperature of water at 1 atm (101.3 kPa) of pressure? Verify that it is 100 °C.
iii. Normal boiling point: this is the boiling point at standard atmospheric pressure (1 atm). Notice that water can be boiled at many temperatures, depending on the pressure. In Denver, Colorado, water boils at 95°C; on Mount Everest, water boils at 70°C. What non-scientists call “boiling point” is what we call “normal boiling point”.
iv. Normal freezing point: This is the freezing point at standard atmospheric pressure (1 atm). Notice that water can be turned to ice at many temperatures, depending on the pressure.
d.
Different substances have different
phase diagrams because they behave differently as the pressure and temperature change.
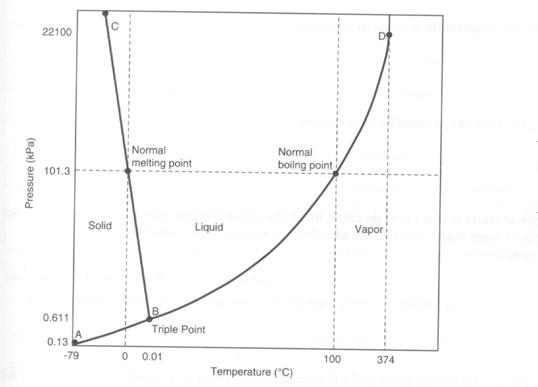
Figure 2 Phase Diagram for water
Figure 3: Another representation of the phase diagram of water.

Figure 4: Phase Diagram for carbon dioxide
Figure 5: Another version of the phase diagram of carbon dioxide
Test your knowledge of phase
diagrams by answering the following questions about the phase diagram for
water:
Given the phase diagram for water (illustrated above) state what phase(s) of
water is/are present at each of the following temperature-pressure conditions:
a) at any point on curve AB
b) at any point on curve BD
c) at any point on curve BC
d) at point B
2. Based on the phase diagram from the previous question, what effect would each of the following changes have on a sample of water at any point on curve BD:
a) increasing the temperature at constant pressure
b) decreasing the pressure at constant temperature
c) decreasing the temperature at constant pressure
d) increasing the pressure at constant temperature
3. Given a sample of water at any point on curve BC in the phase diagram given above, how could more liquid water in the sample be converted into a solid at room temperature?